Peity
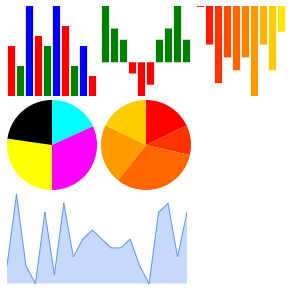
peity.js 是一个基于 canvas 的图表库,支持折线图、柱状图、饼图等。
源码:https://github.com/benpickles/peity
开发文档:https://benpickles.github.io/peity/
示例:
<!DOCTYPE html>
<head>
    <title>无标题页</title>
</head>
<body>
    <span class="bar-colours-1">5,3,9,6,5,9,7,3,5,2</span>
    <span class="bar-colours-2">5,3,2,-1,-3,-2,2,3,5,2</span>
    <span class="bar-colours-3">0,-3,-6,-4,-5,-4,-7,-3,-5,-2</span>
    </br>
    <span class="pie-colours-1">4,7,6,5</span>
    <span class="pie-colours-2">5,3,9,6,5</span>
    </br>
    <span class="updating-chart">5,3,9,6,5,9,7,3,5,2,5,3,9,6,5,9,7,3,5,2</span>
</body>
<script type="text/javascript" src="jQuery.js"></script>
<script type="text/javascript" src="jquery.peity.js"></script>
<script type="text/javascript">
    jQuery(function(){
        $(".bar-colours-1").peity("bar", {
            fill: ["red", "green", "blue"],
            width: 100,
            height: 100,
        })

        $(".bar-colours-2").peity("bar", {
            fill: function(value) {
                return value > 0 ? "green" : "red"
            },
            width: 100,
            height: 100,
        })

        $(".bar-colours-3").peity("bar", {
            fill: function(_, i, all) {
                var g = parseInt((i / all.length) * 255)
                return "rgb(255, " + g + ", 0)"
            },
            width: 100,
            height: 100,
        })

        $(".pie-colours-1").peity("pie", {
            fill: ["cyan", "magenta", "yellow", "black"],
            width: 100,
            height: 100,
        })

        $(".pie-colours-2").peity("pie", {
            fill: function(_, i, all) {
                var g = parseInt((i / all.length) * 255)
                return "rgb(255, " + g + ", 0)"
            },
            width: 100,
            height: 100,
        })

        var updatingChart = $(".updating-chart").peity("line", { width: 200, height: 100 })
        setInterval(function() {
            var random = Math.round(Math.random() * 10)
            var values = updatingChart.text().split(",")
            values.shift()
            values.push(random)

            updatingChart
                .text(values.join(","))
                .change()
        }, 1000)

        $(".peity").on("click", function() {
            alert($(this).text());
        });
    })
</script>
</html>
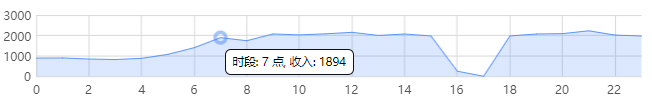
Flot
Flot 是一个基于 canvas 的图表库,支持折线图、柱状图、饼图等。
官网:https://www.flotcharts.org/
源码:https://github.com/flot/flot
示例:
<!DOCTYPE html>
<head>
    <title>无标题页</title>
</head>
<body>
    <div>
        <div id="container" style="height: 100px"></div>
    </div>
</body>
<script src="/static/js/jquery-3.1.1.min.js"></script>

<!-- Flot -->
<script src="/static/js/plugins/flot/jquery.flot.js"></script>
<script src="/static/js/plugins/flot/jquery.flot.tooltip.min.js"></script>
<script src="/static/js/plugins/flot/jquery.flot.resize.js"></script>

<script>
$(function () {
    var barData = {
        label: "bar",
        data: [
            [0,893.52],[1,899.89],[2,847.44],[3,821.83],[4,880.38],[5,1075.36],
            [6,1401.67],[7,1894.46],[8,1744.32],[9,2076.59],[10,2029.04],[11,2083.12],
            [12,2155.55],[13,2001.1],[14,2073.92],[15,1977.13],[16,250.8],[17,0.0],
            [18,1977.13],[19,2073.92],[20,2092.00],[21,2230.35],[22,2020.26],[23,1975.35]
        ]
    };

    var barOptions = {
        series: {
            lines: {
            show: true,
            lineWidth: 1,
            fill: true,
            fillColor: {
                colors: [
                    {opacity: 0.2,},
                    {opacity: 0.2,},
                ],
            },
            },
            points: { show: false },
            shadowSize: 0,
            splines: {
                tension: 1,
            },
        },
        xaxis: {
            tickDecimals: 0,
            show: true
        },
        yaxis: {
            show: true
        },
        colors: ["rgb(77, 137, 249)"],
        grid: {
            color: "#ffffff",
            hoverable: true,
            clickable: true,
            tickColor: "#D4D4D4",
            borderWidth: 0,
            backgroundColor: {
                colors: ["#ffffff", "#ffffff"],
            },
        },
        legend: {
            show: false,
        },
        tooltip: true,
        tooltipOpts: {
            content: "时段: %x 点, 收入: %y",
        },
    };

    $.plot($("#container"), [barData], barOptions);

    $("#container").bind("plotclick", function (event, pos, item) {
        if (item) {
            console.log(
                "点击的数据点的值:",item.datapoint[0].toFixed(2),item.datapoint[1].toFixed(2)
            );
        }
    });
});

</script>
</html>